Forecasting with the R forecast model
Source: Äri-IT Spring 2022
Author: Arvo Sarapuu, BI Consultant at BCS Itera
Forecasting is undoubtedly an advanced technique in the field of business intelligence (BI). However, it is worth the effort as the tools of BI have become highly accurate thanks to machine learning and artificial intelligence (AI).

Forecasting is one of the most complex and valuable levels of business intelligence, with the recommendation of activities being one step further than that. The complexity of these levels is also characterised by the fact that they also already involve machine learning and AI.
R is a programming language used for data analysis and ‘Forecast’ is a specific tool in the R portfolio. The most popular method is perhaps time series forecasting, which analyses the collected data systematically and consistently.
Nevertheless, not all data with a time value qualifies as a forecasting time series – only data collected at regular and continuous intervals should be taken into consideration.
EXAMPLES OF THE APPLICATIONS OF TIME SERIES FORECASTING IN DAILY BUSINESS:
- Time series forecasting is applied in the context of share prices to predict the closing price of a share for each day.
- Cash flow forecasting.
- Retail companies use time series forecasting to forecast product sales and stocks.
- Weather forecasting.
- Forecasting of the population and its variation in different regions.
COMPONENTS OF TIME SERIES FORECASTING
To use time series forecasting, it is essential to understand which temporal pattern the data follows:
- Trend – reflects the long-term flow of data over time.
- Level – establishes the baseline of data, assuming a linear progression over time.
- Seasonality – represents a short-term pattern that occurs at a specific period and repeats regularly and indefinitely.
- Noise – data that is irregular, random or caused by a unique event. Such deviations are not predictable, do not align with the model and are unsuitable as raw data for forecasting models.
There are several models for time series forecasting, with one of the most widely used being the ARIMA (autoregressive integrated moving average) model. It is a combination of an autoregressive (AR) and a moving average (MA) model, where the forecast of the AR model corresponds to a linear combination of the prior values of the variable, the MA model forecast corresponds to a linear combination of previous forecast errors and I indicates the data values that have been replaced with the difference between the current and previous values.
ARIMA TIME SERIES FORECASTING MODEL:
- leverages historical data;
- splits this data into temporal patterns;
- maps these patterns and determines their frequent data points;
- calculates different combinations of how the indicators can be divided;
- combines the data into a single model to forecast future time periods;
- establishes an error percentage to determine the reliability of the forecast.
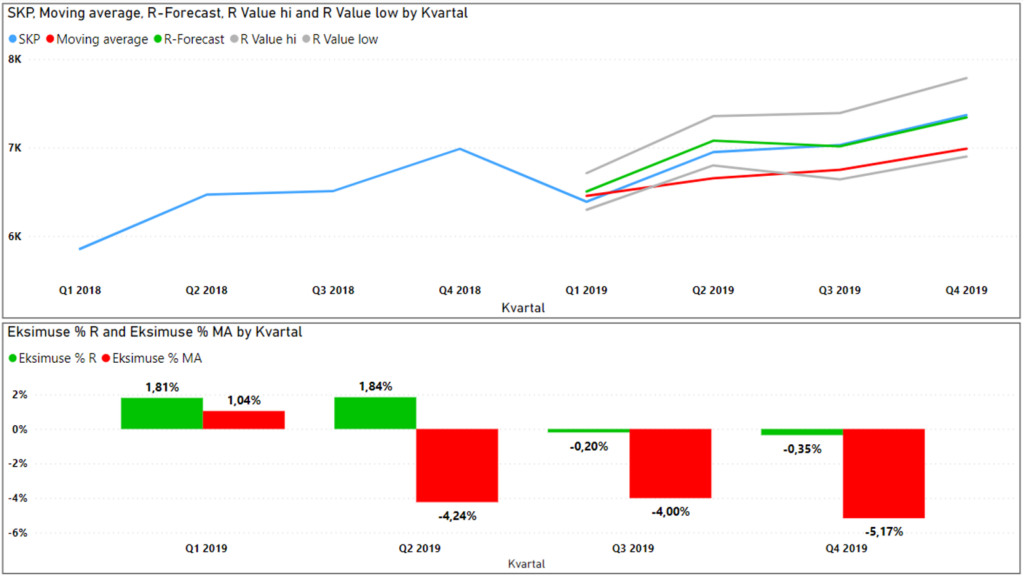
The example below highlights the advantages of R forecast over other forecasting models. Let us take the historical data of Estonian GDP collected by Statistics Estonia, generate a forecast for the already realised data and compare it with actual facts. By using data starting from 1995, we can calculate the forecast, for example, for 2019. The data is presented on a quarterly basis.
If we compare the created forecast with the actual figures for 2019, we can see the high accuracy of the R forecast ARIMA model. Moreover, if we compare it with the conventional moving average model in Excel, the results are significantly more accurate.
This model is a valuable tool in your BI toolkit thanks to its accuracy. Since R forecast lacks its own graphical user interface, Power BI can be used as it has the capability to handle R packages. Power BI is an excellent tool for visualising R forecast models – you just need to import the relevant time series and run a custom R forecast script. When customising, factors such as the cyclicality (seasonality) of the data, the scope of time series and the expected deviation in the forecast must be determined.
In conclusion, by using the R forecast in the Power BI environment, it is possible to easily upgrade your daily dashboards by including forecasts of key indicators.
If you are interested in R forecast, please contact us via email at itera@itera.ee, using ‘Business intelligence’ as the subject.

